How to deploy OMS Alerts with ARM Template
OMS is a great tool, but I can't imagine to set it manually. Most boring part is Alerting, so I prepared ARM Template for that.
Before we start coding we need to understand OMS Alert structure:
SavedSearch/Schedules/Actions - this is the order of Alert creation.
You cannot create Action before Schedule and Schedule before Saved Search. Action needs to be attached to specific Schedule and this needs to be attached to Saved Search. Simple?
Comparing OMS Portal to ARM Template
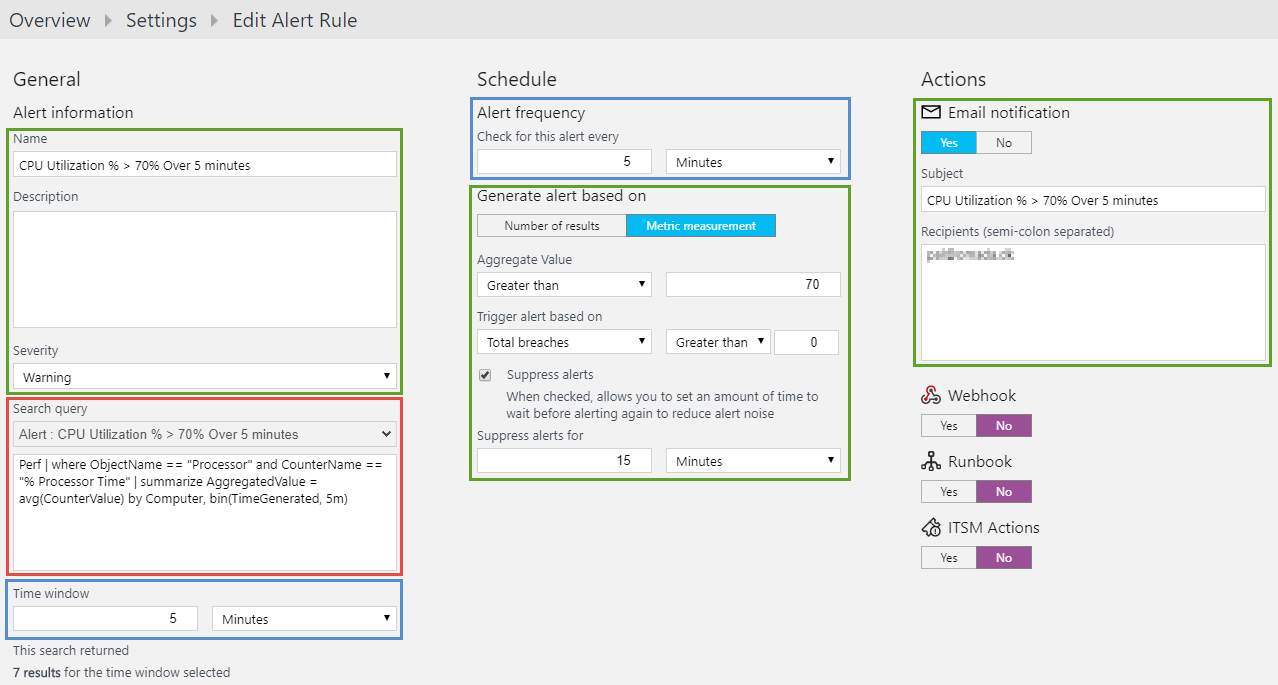
SavedSearch settings are Red.
Schedules settings are Blue.
Actions setting are Green.
Webhook, Runbook and ITSM Actions will be explained in different article.
SavedSearch
{
    "name": "[concat(parameters('workspaceName'), '/', parameters('UniqueNameOfSearch'))]",
    "type": "Microsoft.OperationalInsights/workspaces/savedSearches",
    "apiVersion": "[variables('LogAnalyticsApiVersion')]",
    "dependsOn": [],
    "tags": {},
    "properties": {
        "etag": "*",
        "query": "[parameters('SearchQuery')]",
        "displayName": "[parameters('DisplayNameOfSearch')]",
        "category": "[variables('Category')]"
    }
}
- query - The category for the saved search.
- displayName - Name to display for the saved search in the portal.
- category - Query to run. (Please remember that you need to use escape character for " in ARM Template )
Schedule
{
    "name": "[concat(parameters('workspaceName'), '/', parameters('UniqueNameOfSearch'), '/', variables('ScheduleName'))]",
    "type": "Microsoft.OperationalInsights/workspaces/savedSearches/schedules/",
    "apiVersion": "[variables('LogAnalyticsApiVersion')]",
    "dependsOn": [
        "[concat('Microsoft.OperationalInsights/workspaces/', parameters('workspaceName'), '/savedSearches/', parameters('UniqueNameOfSearch'))]"
    ],
    "properties": {
        "etag": "*",
        "Interval": "[parameters('AlertFrequency')]",
        "QueryTimeSpan": "[parameters('TimeWindow')]",
        "Enabled": true
    }
}
- Interval - ("AlertFrequency" from Portal) How often the query runs in minutes.Specifies how often the query should be run and can be used to make alerts more responsive for the normal case. The value should be equal to or less than the Alert time window.
5-1440 min - QueryTimeSpan - ("Time window" from Portal) Specifies the time range for the query. The query returns only records that were created within this range of the current time.
5-1440 min - Enabled - Specifies whether the alert is enabled when it's created.
Actions
{
    "name": "[concat(parameters('workspaceName'), '/', parameters('UniqueNameOfSearch'), '/', variables('ScheduleName'), '/', variables('AlertName'))]",
    "type": "Microsoft.OperationalInsights/workspaces/savedSearches/schedules/actions",
    "apiVersion": "[variables('LogAnalyticsApiVersion')]",
    "dependsOn": [
        "[concat('Microsoft.OperationalInsights/workspaces/', parameters('workspaceName'), '/savedSearches/', parameters('UniqueNameOfSearch'), '/schedules/', variables('ScheduleName'))]"
    ],
    "properties": {
        "etag": "*",
        "Type": "Alert",
        "Name": "[parameters('DisplayNameOfSearch')]",
        "Description": "[parameters('Description')]",
        "Severity": "[parameters('Severity')]",
        "Threshold": {
            "Operator": "[parameters('AggregateValueOperator')]",
            "Value": "[parameters('AggregateValue')]",
            "MetricsTrigger": {
                "TriggerCondition": "[parameters('TriggerAlertCondition')]",
                "Operator": "[parameters('TriggerAlertOperator')]",
                "Value": "[parameters('TriggerAlertValue')]"
            }
        },
        "Throttling": {
            "DurationInMinutes": 30
        },
        "EmailNotification": {
            "Recipients": [
                "[parameters('EmailRecipients')]"
            ],
            "Subject": "[parameters('DisplayNameOfSearch')]"
        }
    }
}
Please be aware that name settings in "Action" are case sensitive. If, like me, you change the name of "Operator" to "operator", the ARM Template will return the error. :)
- Type - Mandatory type is "Alert".
- Name - Display name for the alert.
- Description - Optional description of the alert.
- Severity - Severity of any alerts.
Critical\Warning\Informational
Threshold:
- Operator - Operator for the comparison from the following values.
gt = greater than\lt = less than - Value - The value to compare the results.
0-10000
Each alert rule in Log Analytics is one of two types:
- Number of results. Single alert created when the number records returned by the log search exceed a specified number.
- Metric measurement. Alert created for each object in the results of the log search with values that exceed specified threshold.
From ARM template view, if you remove section "MetricsTrigger" you will have alert with "Number of results":
MetricsTrigger:
- TriggerCondition - Specifies whether the threshold is for total number of breaches or consecutive breaches.
Total\Consecutive - Operator - Operator for the comparison.
gt = greater than\eq = equal to - Value - Number of the times the criteria must be met to trigger the alert.
0-10000
Throttling:
- DurationInMinutes - Number of minutes to suppress alerts after one from the same alert rule is created.
0-10000 min
EmailNotification:
- EmailRecipients - Comma-delimited list of email addresses to send notification when an alert.
- Subject - Subject line of the mail.
If we take everything together with the parameters in one ARM Template it looks like this:
{
    "$schema": "https://schema.management.azure.com/schemas/2015-01-01/deploymentTemplate.json#",
    "contentVersion": "1.0",
    "parameters": {
        "workspaceName": {
            "type": "string",
            "metadata": {
                "Description": "Name of Log Analytics workspace"
            }
        },
        "EmailRecipients": {
            "type": "string",
            "defaultValue":"some@email.com",
            "metadata": {
                "Description": "List of recipients for the email alert separated by semicolon"
            }
        },
        "DisplayNameOfSearch": {
            "type": "string",
            "defaultValue": "Memory Utilization % > 90% Over 5 minutes",
            "metadata": {
                "Description": "Name of search query"
            }
        },
        "UniqueNameOfSearch": {
            "type": "string",
            "defaultValue": "Memory-Utilization-90",
            "metadata": {
                "Description": "Unique Name Of Search. Please dont use special characters"
            }
        },
        "Description": {
            "type": "string",
            "defaultValue": "Description",
            "metadata": {
                "Description": "Unique Name Of Search. Please dont use special characters"
            }
        },
        "SearchQuery": {
            "type": "string",
            "defaultValue": "Perf | where ObjectName == \"Memory\" | where CounterName == \"% Committed Bytes In Use\" | summarize AggregatedValue = avg(CounterValue) by Computer, bin(TimeGenerated, 5min)",
            "metadata": {
                "Description": "SearchQuery. Please remember to use '' in powershell or escape character \" from ARM"
            }
        },
        "Severity": {
            "type": "string",
            "allowedValues": [
                "Critical",
                "Warning",
                "Informational"
            ],
            "defaultValue": "Critical",
            "metadata": {
                "Description": "Severity of alert"
            }
        },
        "TimeWindow": {
            "type": "int",
            "defaultValue": 10,
            "minValue": 5,
            "maxValue": 1440,
            "metadata": {
                "Description": "Length of time in minutes over which to evaluate results. Must be greater than or equal to AlertFrequency"
            }
        },
        "AlertFrequency": {
            "type": "int",
            "defaultValue": 5,
            "minValue": 5,
            "maxValue": 1440,
            "metadata": {
                "Description": "How often the query runs in minutes."
            }
        },
        "AggregateValueOperator": {
            "type": "string",
            "allowedValues": [
                "gt",
                "lt"
            ],
            "defaultValue": "gt",
            "metadata": {
                "Description": "gt = greater than or lt = less than"
            }
        },
        "AggregateValue": {
            "type": "int",
            "defaultValue": 70,
            "minValue": 0,
            "maxValue": 10000,
            "metadata": {
                "Description": "The value to compare the results"
            }
        },
        "TriggerAlertCondition": {
            "type": "string",
            "allowedValues": [
                "Total",
                "Consecutive"
            ],
            "defaultValue": "Total",
            "metadata": {
                "Description": "Total or Consecutive"
            }
        },
        "TriggerAlertOperator": {
            "type": "string",
            "allowedValues": [
                "gt",
                "eq"
            ],
            "defaultValue": "gt",
            "metadata": {
                "Description": "gt = greater than or eq = equal to"
            }
        },
        "TriggerAlertValue": {
            "type": "int",
            "defaultValue": 0,
            "minValue": 0,
            "maxValue": 10000,
            "metadata": {
                "Description": "Number of the times the criteria must be met to trigger the alert."
            }
        }
    },
    "variables": {
        "LogAnalyticsApiVersion": "2017-03-03-preview",
        "Category": "Alert",
        "ScheduleName": "[toLower(concat('schedule-', parameters('UniqueNameOfSearch'), '-', uniqueString(resourceGroup().id, deployment().name)))]",
        "AlertName": "[toLower(concat('alert-', parameters('UniqueNameOfSearch'), '-', uniqueString(resourceGroup().id, deployment().name) ))]"
    },
    "resources": [
        {
            "name": "[concat(parameters('workspaceName'), '/', parameters('UniqueNameOfSearch'))]",
            "type": "Microsoft.OperationalInsights/workspaces/savedSearches",
            "apiVersion": "[variables('LogAnalyticsApiVersion')]",
            "dependsOn": [],
            "tags": {},
            "properties": {
                "etag": "*",
                "query": "[parameters('SearchQuery')]",
                "displayName": "[parameters('DisplayNameOfSearch')]",
                "category": "[variables('Category')]"
            }
        },
        {
            "name": "[concat(parameters('workspaceName'), '/', parameters('UniqueNameOfSearch'), '/', variables('ScheduleName'))]",
            "type": "Microsoft.OperationalInsights/workspaces/savedSearches/schedules/",
            "apiVersion": "[variables('LogAnalyticsApiVersion')]",
            "dependsOn": [
                "[concat('Microsoft.OperationalInsights/workspaces/', parameters('workspaceName'), '/savedSearches/', parameters('UniqueNameOfSearch'))]"
            ],
            "properties": {
                "etag": "*",
                "Interval": "[parameters('AlertFrequency')]",
                "QueryTimeSpan": "[parameters('TimeWindow')]",
                "Enabled": true
            }
        },
        {
            "name": "[concat(parameters('workspaceName'), '/', parameters('UniqueNameOfSearch'), '/', variables('ScheduleName'), '/', variables('AlertName'))]",
            "type": "Microsoft.OperationalInsights/workspaces/savedSearches/schedules/actions",
            "apiVersion": "[variables('LogAnalyticsApiVersion')]",
            "dependsOn": [
                "[concat('Microsoft.OperationalInsights/workspaces/', parameters('workspaceName'), '/savedSearches/', parameters('UniqueNameOfSearch'), '/schedules/', variables('ScheduleName'))]"
            ],
            "properties": {
                "etag": "*",
                "Type": "Alert",
                "Name": "[parameters('DisplayNameOfSearch')]",
                "Description": "[parameters('Description')]",
                "Severity": "[parameters('Severity')]",
                "Threshold": {
                    "Operator": "[parameters('AggregateValueOperator')]",
                    "Value": "[parameters('AggregateValue')]",
                    "MetricsTrigger": {
                        "TriggerCondition": "[parameters('TriggerAlertCondition')]",
                        "Operator": "[parameters('TriggerAlertOperator')]",
                        "Value": "[parameters('TriggerAlertValue')]"
                    }
                },
                "Throttling": {
                    "DurationInMinutes": 30
                },
                "EmailNotification": {
                    "Recipients": [
                        "[parameters('EmailRecipients')]"
                    ],
                    "Subject": "[parameters('DisplayNameOfSearch')]"
                }
            }
        }
    ],
    "outputs": {}
}
You can easily call this with parameters file or PowerShell.
New-AzureRmResourceGroupDeployment -Name "alert" -ResourceGroupName $ResourceGroupOMS -TemplateFile "alerts-metric-measurement.json" -workspaceName $WorkspaceName `
-DisplayNameOfSearch "Test 80 memory" `
-UniqueNameOfSearch "test-80-memory" `
-Description "test" `
-SearchQuery 'Perf | where ObjectName == "Memory" | where CounterName == "% Committed Bytes In Use" | summarize AggregatedValue = avg(CounterValue) by Computer, bin(TimeGenerated, 5min)' `
-Severity "Critical" `
-TimeWindow 10 `
-AlertFrequency 5 `
-AggregateValueOperator "gt" `
-AggregateValue 70 `
-TriggerAlertCondition "Total" `
-TriggerAlertOperator "gt" `
-TriggerAlertValue 70
For more fun please visit https://docs.microsoft.com/en-us/azure/log-analytics/log-analytics-alerts